Introduction
A fishbone diagram is a visual tool used to identify and analyse the possible causes of a problem or an effect. The diagram gets its name from its shape, which resembles the skeleton of a fish.
Fishbone Diagram
The fishbone diagram is also known as Ishikawa diagram or cause-and-effect diagram. The diagram gets its name from its appearance, resembling the skeleton of a fish, with the problem or effect being depicted as the head and the potential causes branching out like fishbones. The main categories of causes typically include people, process, equipment, materials, environment, and management.
Description
What is this technique/tool about
The fishbone diagram is used to plan a brainstorming session so that a team may come up with every potential root cause of an issue. The name of the diagram comes from how it looks, which is like a fish skeleton. The bones of the fish stand in for several kinds of causes, while the fish's head represents the issue or impact being studied. The key categories of causes, which may include people, process, equipment, materials, environment, and management, are often listed on the bones of the fish. The team can brainstorm all the probable reasons that fall into each category after the categories have been established. This procedure aids in locating the main source of the issue and deciding which reasons need to be addressed to solve it. Overall, the fishbone diagram is a helpful tool for problem-solving because it makes it easier to pinpoint the root reasons of an issue and encourages team members to communicate and work together.
For which purposes is it used (why in your secondary school teaching)
The fishbone diagram can be used for various purposes, including:
- Problem-solving: The fishbone diagram can be used as a teaching tool to introduce students to problem-solving techniques. By demonstrating how to use the diagram to identify causes and solutions, students can learn how to approach complex problems in a structured and methodical way.
- Collaboration: The fishbone diagram can be used in group activities to promote collaboration and teamwork among students. By working together to identify the causes of a problem, students can learn to communicate effectively and build trust with one another.
- Critical thinking: The fishbone diagram encourages students to evaluate complicated issues and pinpoint the root causes, which can aid in the development of their critical thinking abilities.
Limitations
The fishbone diagram can be a useful tool for problem-solving, collaboration, and critical thinking, it also has some limitations. These include:
- Bias: The fishbone diagram is dependent on the expertise and viewpoints of the people engaged in the problem-solving procedure. Results may be erroneous or incomplete if there is prejudice or a lack of understanding among the team members.
- Complexity: If there are several causes and sub-causes to consider, the fishbone diagram may become complicated and challenging to maintain. Because of this, figuring out the problem's underlying causes and prioritizing which ones to treat might be difficult.
- Time-consuming: Drawing a fishbone diagram can take a lot of effort, especially if a large team is involved. When there is a short deadline or not enough funding for the problem-solving process, this might be a drawback.
- Lack of objectivity: The fishbone diagram is an arbitrary tool that depends on the interpretation and assessment of the parties concerned. As a result, team members may dispute about the discovered reasons and remedies, which might slow down the problem-solving process.
How to implement these technique/tools
The implementation of the fishbone diagram typically involves the following steps:
Preparation, before the session:
- Define the problem or effect: Clearly identify the issue that you want to analyse using the fishbone diagram.
- Assemble a cross-functional team: Gather a diverse group of individuals who possess knowledge and expertise related to the problem. This can include participants from different disciplines.
- Collect data: Gather relevant information and data related to the problem. This may involve conducting interviews, reviewing documents, or analysing existing data.
- Prepare the diagram template: Draw the fishbone diagram on a whiteboard, flipchart, or using software tools. Draw a horizontal line across the centre of the diagram and label it with the problem or effect statement.
During the session:
- Identify major categories: Facilitate a brainstorming session with the team to determine the major categories or potential causes related to the problem.
- Generate subcategories: Encourage the team to delve deeper into each major category and identify specific subcategories that could contribute to the problem. These subcategories will serve as branches off the main categories on the diagram.
- Identify causes: Within each subcategory, facilitate a discussion to identify the potential causes or factors that could be influencing the problem. Write these causes as smaller branches stemming from the corresponding subcategories.
Follow-up after the session:
- Analyse the causes: Review and analyse the identified causes on the fishbone diagram. Look for patterns, relationships, and potential areas of focus for problem-solving.
- Prioritize the causes: Evaluate the causes based on their significance and impact on the problem. Prioritize the causes that are most likely to address the root issue effectively.
- Develop an action plan: Based on the prioritized causes, create an action plan with specific steps and responsibilities to address and mitigate the identified causes.
- Implement and monitor: Execute the action plan and track the progress of the implemented solutions. Regularly assess and monitor the results to ensure that the problem is being addressed effectively.
Examples and/or testimonials
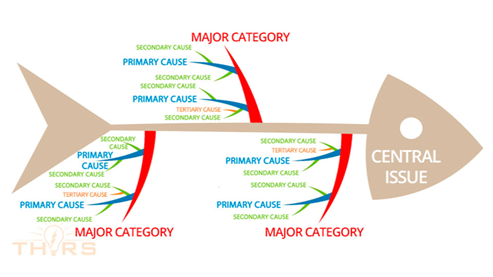
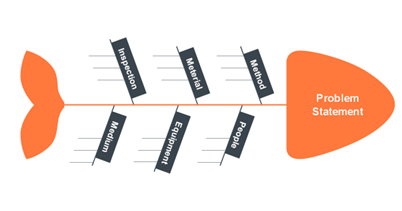
Using the fishbone diagram in education can support students' performance, problem-solving skills, collaboration skills, and critical thinking skills. A few fishbone diagram examples are given below.

Figure 1. A fishbone diagram example (Source: https://thors.com/fishbone-diagrams-help-solve-manufacturing-problems/)

Figure 2. A fishbone diagram example (Source: https://www.edrawmind.com/templates/fishbone-diagram-template.html)
Tools needed
To apply fishbone face to face, basic components such as paper, pencil, whiteboard are needed. In the online environment, online conferencing tools and online design tools can be used. Examples of these tools are Creately, Miro, Canva, Monday, Zoom, Teams, Meet, etc.
Resources
Links:
- https://www.techtarget.com/whatis/definition/fishbone-diagram
- https://asq.org/quality-resources/fishbone
Videos:
Books:
- Fishbone Diagram A Complete Guide - 2021 Edition– November 10, 2020
- Cause & Effect Fishbone Diagram: Composition Notebook | Root Cause Analysis for Healthcare, Education, Business, Quality | Ishikawa Diagrams– August 12, 2021